
When supporting young learners, measuring progress means looking past simple right-or-wrong scores. Growth shows up in subtle shifts: a child needing a verbal hint instead of a hand-over-hand guide, or demonstrating a self-regulation skill during unstructured play that didn’t show up on a direct test.
With our Back to School release for Launch for PreK, we set out to build and enhance reports that capture incremental growth and nuanced moments. These tools transform everyday classroom tracking into actionable, forward-looking guidance for both teachers and administrators.
Conventional progress monitoring often focuses on mastery percentages, such as whether a student answered eight out of ten items correctly. However, that metric misses a critical piece of the puzzle: how much help the child needed along the way.
The upgraded Skill Progress Report centers directly on prompt fading over time. Teachers can see whether a student is moving from physical modeling toward independent responses, helping them spot when a child is ready for less support. The report also automatically flags “instructional movers” – highlighting areas where a student is building momentum or where progress has stalled – so educators can adjust their approach in real time rather than waiting for formal reporting periods. Detailed line charts make it easy to prepare for IEP meetings or family conferences with clear, visual context.
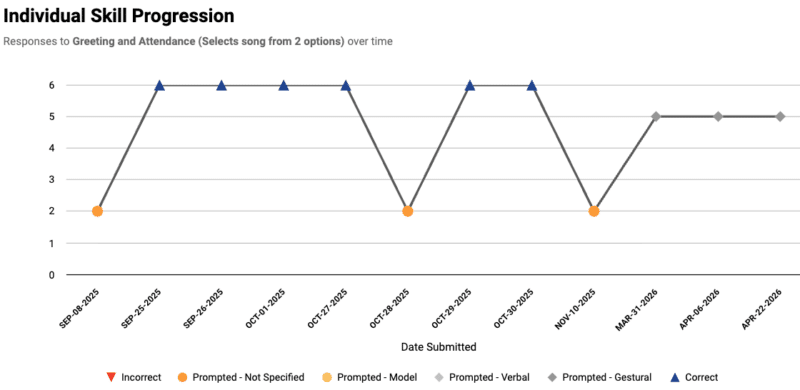
One of the persistent challenges in early childhood assessment and evaluation is the gap between structured testing and natural behavior. A child might struggle on a formal assessment task, leaving team members to wonder whether the issue stems from an underlying skill deficit or a temporary attention barrier.
Our new Kindergarten Readiness Combo Report bridges this gap by presenting standardized benchmark results alongside observational data in a single dashboard. By comparing how a child performs under testing conditions with how they function in their typical classroom routine, educators can pinpoint the root cause of learning barriers and design more effective, whole-child interventions.
Observational assessments offer rich, qualitative details, but digesting that information across multiple domains can feel overwhelming. The revised Observational Assessment Suite streamlines this workflow. Dynamic summaries display average developmental ranges along with practical, tailored suggestions for skill development. Visual heatmaps reveal performance patterns across individual tasks, ensuring specific skill gaps do not hide behind high overall averages.
For district leaders, high-level oversight requires both big-picture trends and practical accuracy. The Observational Assessments Overview Report pairs percentage-based analytics with exact student counts. In smaller specialized settings where a tiny sample size can artificially inflate percentage drops, this dual view prevents unnecessary alarm and ensures resources go where they are truly needed. Complete, exportable raw data tables also give administrative teams the agility required for compliance checks and targeted professional development.